import torch
import math
import matplotlib.pyplot as plt
from functools import partialtorch.set_printoptions(precision=3, linewidth=140, sci_mode=False)1 K-means
This implement of k-means is a home work of fastai course part2.
2 Create Data
n_clusters = 6
n_samples = 250
centroids = torch.rand(n_clusters, 2)*70-35centroidstensor([[ -3.628, 18.403],
[ -7.049, -8.394],
[ 14.369, 2.944],
[ 22.497, -17.995],
[-24.635, 33.245],
[ 13.786, 12.422]])from torch.distributions.multivariate_normal import MultivariateNormal
from torch import tensordef sample(m): return MultivariateNormal(m, torch.diag(tensor([30.,30.]))).sample((n_samples,))slices = [sample(c) for c in centroids]
data = torch.cat(slices)
data.shapetorch.Size([1500, 2])def plot_data(centroids, data, n_samples, ax=None):
if ax is None: _,ax = plt.subplots()
for i, centroid in enumerate(centroids):
samples = data[i*n_samples:(i+1)*n_samples]
ax.scatter(samples[:,0], samples[:,1], s=1)
ax.plot(*centroid, markersize=10, marker="x", color='k', mew=5)
ax.plot(*centroid, markersize=5, marker="x", color='m', mew=2)plot_data(centroids, data, 250)
3 k-means
X = data.clone()3.1 Init mean
k = 6perm = torch.randperm(X.size(0))idx = perm[:k]
means = X[idx].clone()
meanstensor([[ 13.227, -8.303],
[ 11.784, 11.362],
[ 15.491, -4.326],
[ 12.847, -19.425],
[ 15.780, 17.934],
[ -2.511, -3.635]])plot_data(means, X, 250)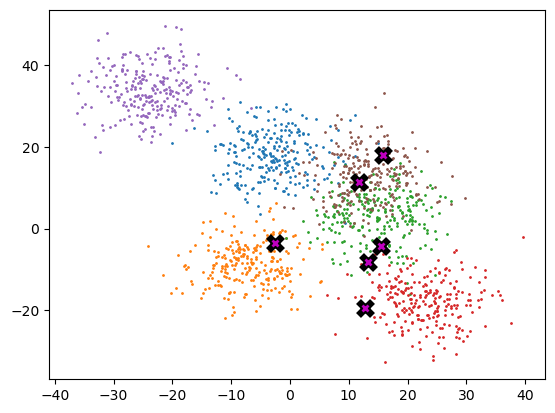
3.2 Calculate distance
means.shape, X.shape(torch.Size([6, 2]), torch.Size([1500, 2]))means[:, None].shape, X[None].shape(torch.Size([6, 1, 2]), torch.Size([1, 1500, 2]))(means[:, None] - X[None]).shapetorch.Size([6, 1500, 2])mm = means[:, None] - X[None]l2 = torch.einsum('ijk, ijk->ij', mm, mm)l2tensor([[ 734.640, 709.354, 706.383, ..., 569.188, 1460.258, 1255.919],
[ 297.342, 241.198, 183.035, ..., 60.147, 350.148, 249.417],
[ 684.036, 643.628, 618.255, ..., 380.736, 1172.179, 1018.224],
[1281.019, 1277.346, 1310.853, ..., 1213.889, 2434.660, 2157.942],
[ 494.725, 412.703, 316.399, ..., 17.422, 144.967, 130.433],
[ 232.653, 253.557, 305.201, ..., 793.216, 1409.568, 1052.514]])l2.shapetorch.Size([6, 1500])(mm * mm).sum(2)tensor([[ 734.640, 709.354, 706.383, ..., 569.188, 1460.258, 1255.919],
[ 297.342, 241.198, 183.035, ..., 60.147, 350.148, 249.417],
[ 684.036, 643.628, 618.255, ..., 380.736, 1172.179, 1018.224],
[1281.019, 1277.346, 1310.853, ..., 1213.889, 2434.660, 2157.942],
[ 494.725, 412.703, 316.399, ..., 17.422, 144.967, 130.433],
[ 232.653, 253.557, 305.201, ..., 793.216, 1409.568, 1052.514]])(mm * mm).sum(2).shapetorch.Size([6, 1500])3.3 Select nearest group
group = torch.argmin(l2, dim=0)group.shapetorch.Size([1500])3.4 Update mean
X[group == 0].shapetorch.Size([47, 2])torch.mean(X, 0)tensor([2.815, 6.901])for i in range(k):
means[i] = torch.mean(X[group == i], 0)meanstensor([[ 15.741, -10.534],
[ 0.595, 16.672],
[ 18.710, -2.103],
[ 22.234, -19.903],
[ 2.595, 25.472],
[-11.656, 2.780]])plot_data(means, data, 250)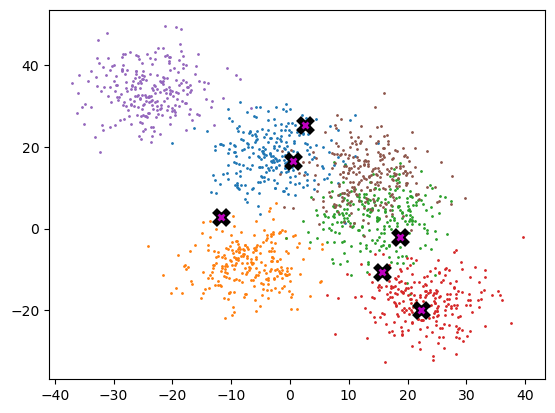
3.5 Write update loop
def update(means, X, n):
for t in range(n):
mm = means[:, None] - X[None]
l2 = torch.einsum('ijk, ijk->ij', mm, mm)
group = torch.argmin(l2, dim=0)
for i in range(k):
means[i] = torch.mean(X[group == i], 0)update(means, X, 10)plot_data(means, data, 250)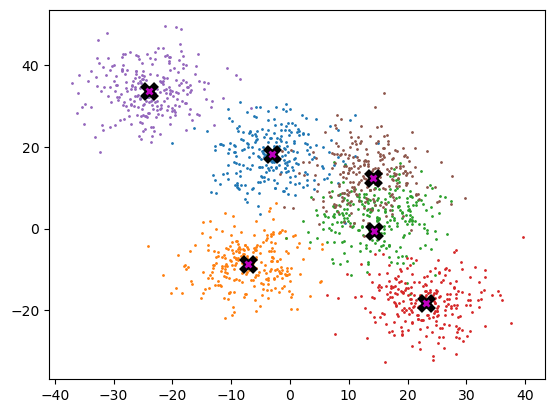
3.6 Write k-means function
def kmeans(X, k, n):
    # init means
    perm = torch.randperm(X.size(0))
    idx = perm[:k]
    means = X[idx].clone()

    for t in range(n):
        mm = means[:, None] - X[None]
        l2 = torch.einsum('ijk, ijk->ij', mm, mm)
        group = torch.argmin(l2, dim=0)
        for i in range(k):
            means[i] = torch.mean(X[group == i], 0)

    return means
means = kmeans(X, 6, 10)plot_data(means, data, 250)
4 Animation
from matplotlib.animation import FuncAnimation
from IPython.display import HTML
def init_means(X, k):
perm = torch.randperm(X.size(0))
idx = perm[:k]
means = X[idx].clone()
return meansdef one_update(X, means, k):
mm = means[:, None] - X[None]
l2 = torch.einsum('ijk, ijk->ij', mm, mm)
group = torch.argmin(l2, dim=0)
for i in range(k):
means[i] = torch.mean(X[group == i], 0)
return groupdef plot_data_group(centroids, group, data, ax=None):
if ax is None: _,ax = plt.subplots()
for i, centroid in enumerate(centroids):
samples = data[group == i]
ax.scatter(samples[:,0], samples[:,1], s=1)
ax.plot(*centroid, markersize=10, marker="x", color='k', mew=5)
ax.plot(*centroid, markersize=5, marker="x", color='m', mew=2)def do_one(d, means, k):
pre_means = means.clone()
group = one_update(X, means, k)
ax.clear()
plot_data_group(pre_means, group, X, ax=ax)X = data.clone()
k = 5
fig,ax = plt.subplots()
means = init_means(X, k)
f1 = partial(do_one, means=means, k=k)
ani = FuncAnimation(fig, f1, frames=10, interval=500, repeat=False)
plt.close()
HTML(ani.to_jshtml())